Graphviz - Graph Visualization Software
Graph visualization is a way of representing structural
information as diagrams of abstract graphs and networks.
Automatic graph drawing has many important applications in
software engineering, database and web design, networking,
and in visual interfaces for many other domains.

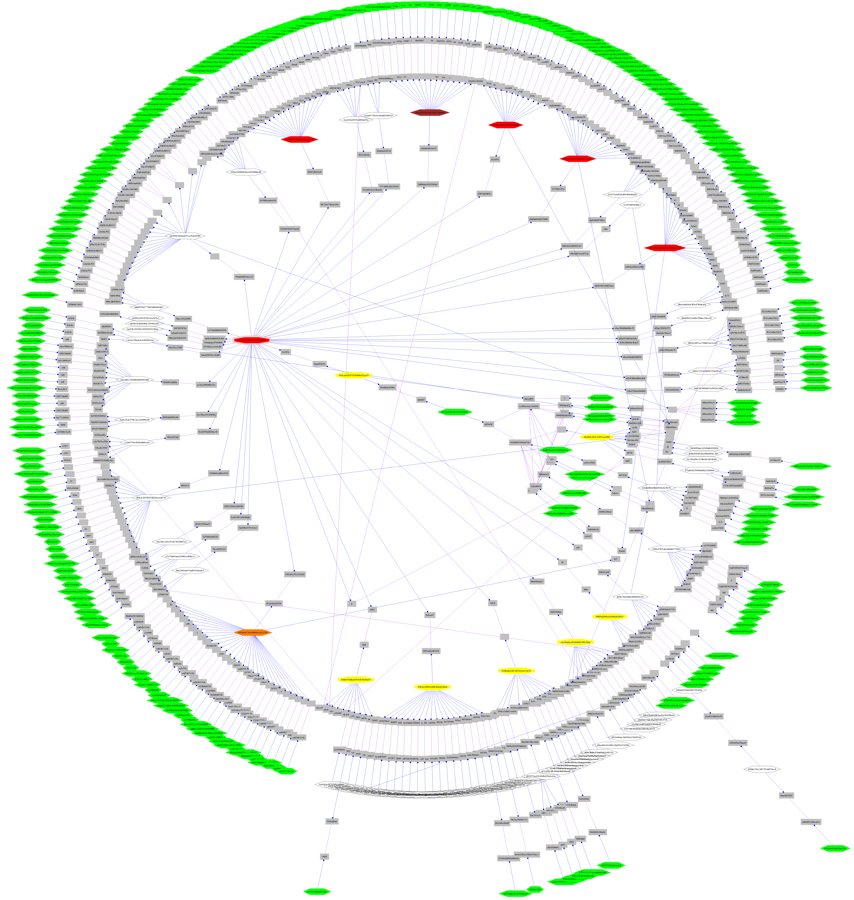
A real-world network containing 300 sites over 40 countries.
The diagram was made to trace network incidents and to support maintenance.
Original names and other details were obfuscated for anonymity.
Graphviz is open source graph visualization software. It has several main graph layout programs. See the gallery for some sample layouts. It also has web and interactive graphical interfaces, and auxiliary tools, libraries, and language bindings.
The Graphviz layout programs take descriptions of graphs in a simple text language, and make diagrams in several useful formats such as images and SVG for web pages, Postscript for inclusion in PDF or other documents; or display in an interactive graph browser. (Graphviz also supports GXL, an XML dialect.)